
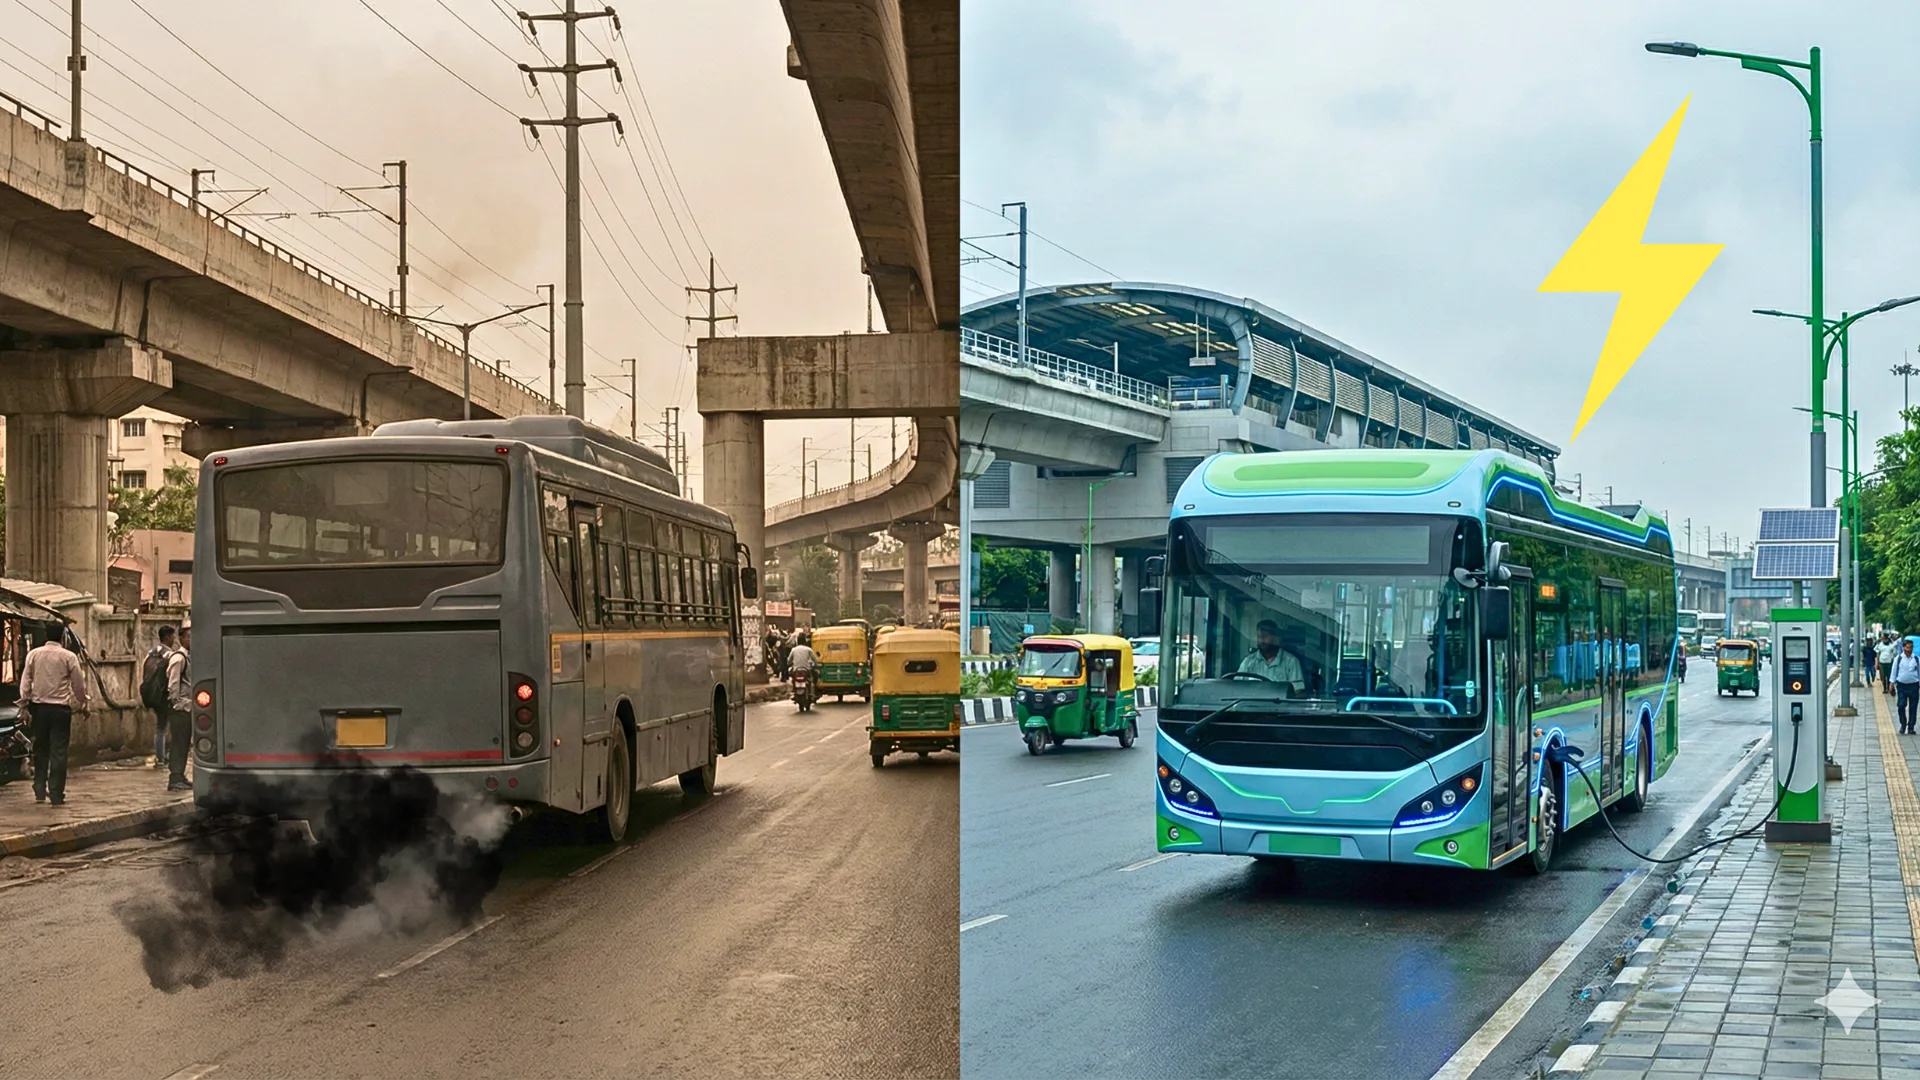
The ongoing diesel vs electric bus debate received a rare, data-first intervention when Randheer Singh, EV value-chain consultant and former Director at NITI Aayog, shared a detailed post on LinkedIn highlighting a transparent Total Cost of Ownership (TCO) comparison developed by ForeSee Advisors.
Instead of opinions or selective claims, the post announced the public release of a fully built Excel-based TCO model comparing a 12-metre diesel city bus and a 12-metre electric city bus.
The model openly lays out every assumption from capex and financing to fuel, energy, maintenance, battery replacement, cash flows, NPV, and IRR, allowing anyone to test, challenge, or adapt the numbers to real-world conditions.
What makes this release significant is not the conclusion, but the approach: no black boxes, no hidden assumptions, and no narrative framing. For a sector where procurement decisions lock cities into 10–15 year commitments, this level of transparency is both rare and necessary.
Evaluation Framework: Time Horizon and Bus Utilisation
Before comparing technologies, the model fixes the operating context. This prevents biased conclusions driven by unrealistic usage assumptions.
Core Evaluation Parameters
| Parameter | Value |
|---|---|
| Analysis start year | 2026 |
| Evaluation horizon (short-term) | 7 years |
| Evaluation horizon (long-term) | 12 years |
| Annual km per bus | 72,000 km |
What does this data mean
-
72,000 km per year translates to ~200 km per day, which aligns with real city bus operations in large Indian metros.
-
The 7-year horizon mirrors typical financing and operating contracts.
-
The 12-year horizon reflects the true economic life of a city bus.
By holding kilometres constant for both diesel and electric buses, the model isolates technology-driven cost differences, rather than utilisation effects.
Diesel Bus: Cost Assumptions and Their Implications
Diesel Bus Assumptions (12m BS6 City Bus)
| Parameter | Value |
|---|---|
| Purchase price | ₹90,00,000 |
| Fuel efficiency | 3.5 km/litre |
| Diesel price | ₹87.65 / litre |
| Maintenance cost | ₹12 / km |
| Other opex (staff, permits, insurance) | ₹20 / km |
| Mid-life overhaul | 20% of capex (Year 7) |
| Residual value | 5% of capex (optional) |
What this data tells us
-
The ₹90 lakh capex reflects recent OEM and tender pricing — not outdated figures.
-
At 3.5 km/litre, fuel consumption is conservative, avoiding best-case bias.
-
Fuel cost alone works out to approximately ₹25 per km in Year 1, making diesel highly sensitive to price fluctuations.
-
The mid-life overhaul in year 7 captures a real cost often ignored in simplified comparisons, covering engine and drivetrain aggregation.
This table highlights a key truth: diesel buses have predictable but unavoidable operating costs that persist across the vehicle’s life.
Electric Bus: Cost Assumptions and Their Implications
Electric Bus Assumptions (12m AC City Bus)
| Parameter | Value |
|---|---|
| Purchase price (incl. battery) | ₹1,50,00,000 |
| Battery capacity | 250 kWh |
| Battery cost | ₹12,000 / kWh |
| Battery share of bus cost | 20% |
| Energy consumption | 1.3 kWh / km |
| Electricity tariff | ₹5 / kWh |
| Maintenance cost | ₹8 / km |
| Other opex | ₹20 / km |
| Battery replacement | Year 7 |
| Battery salvage value | 20% of new pack |
What this data tells us
-
The higher upfront price is driven largely by the battery, not the chassis.
-
Energy consumption at 1.3 kWh/km reflects real tender caps used by state transport undertakings.
-
Electricity at ₹5/kWh includes taxes, avoiding artificially low assumptions.
-
Maintenance is lower because electric buses eliminate engines, gearboxes, and exhaust systems.
-
Importantly, battery replacement is explicitly included, removing a common criticism of EV TCO studies.
This table shows that electric buses trade a higher initial investment for structurally lower running costs.
Fuel vs Energy Cost Comparison (Year 1)
Direct Operating Cost Comparison
| Cost Component | Diesel Bus | Electric Bus |
|---|---|---|
| Fuel/energy cost per km | ₹25.0 | ₹6.5 |
| Total opex per km | ₹57.0 | ₹34.5 |
What this data tells us
-
Diesel fuel costs are nearly 4× higher per km than electricity.
-
Even before financing or replacement costs, electric buses enjoy a ₹22.5/km operating advantage.
-
Over 72,000 km annually, this difference alone exceeds ₹16 lakh per bus per year.
This operating gap is the single most important driver of electric bus economics.
Financing and Commercial Assumptions
Financing & Revenue Parameters
| Parameter | Value |
|---|---|
| Debt share of capex | 80% |
| Interest rate | 10% |
| Loan tenure | 7 years |
| Discount rate (real) | 10% |
| Revenue per km | ₹95 |
| Diesel price escalation | 3% per year |
| Electricity tariff escalation | 2% per year |
What this data tells us
-
Both technologies are evaluated under identical financing conditions, ensuring neutrality.
-
Diesel prices are assumed to rise faster than electricity tariffs, reflecting historical trends.
-
Revenue per km reflects GCC / hire-based contracts commonly used by STUs.
This ensures that differences in outcomes come from technology economics, not financing bias.
Diesel Bus vs Electric Bus 7-Year Results: Medium-Term Economics
7-Year TCO Summary (5.04 lakh km)
| Metric | Diesel Bus | Electric Bus |
|---|---|---|
| Levelised TCO (₹/km) | 61 | 56 |
| NPV of costs | ₹3.06 crore | ₹2.84 crore |
| Equity NPV | ₹98.6 lakh | ₹1.69 crore |
What this data tells us
-
Even within seven years, electric buses are already ₹5/km cheaper on a discounted basis.
-
Despite battery replacement in year 7, EVs deliver ~70% higher equity value.
-
This directly challenges the belief that EVs only work over very long horizons.
12-Year Results: Full Lifecycle Economics
12-Year TCO Summary (8.64 lakh km)
| Metric | Diesel Bus | Electric Bus |
|---|---|---|
| Levelised TCO (₹/km) | 45.8 | 37.9 |
| NPV of costs | ₹3.95 crore | ₹3.28 crore |
| Equity NPV | ₹1.43 crore | ₹2.58 crore |
What this data tells us
-
Electric buses are ~17% cheaper per km over full life.
-
Equity value for EVs is nearly 1.8× higher than diesel.
-
At fleet scale, this difference materially affects subsidy requirements and operator viability.
This is where lifecycle thinking clearly favours electric buses.
Here’s What Final Data Proves
| Insight | What the Numbers Show |
|---|---|
| Upfront cost is misleading | Opex dominates long-term outcomes |
| Battery replacement is not fatal | Already accounted for |
| Utilisation is decisive | Higher km strengthens EV economics |
| Transparency enables trust | Every assumption is visible |
The model does not claim electric buses are universally superior.
It shows exactly when, why, and by how much they outperform diesel under defined conditions.
Recent IISc Bengaluru Electric Bus Study
A study by the Indian Institute of Science (IISc) found that when an electric bus and a diesel bus ran on the same route in Bengaluru, the electric bus delivered about 27 % more revenue and 82 % more profit per day than the diesel counterpart.
This was primarily because the electric bus had significantly lower energy and maintenance costs, even though both buses earned similar revenue.
In environmental terms, switching one diesel bus to electric could cut around 25 tonnes of CO₂ annually, highlighting both economic and emissions benefits in real-world urban operations.
Final Takeaway
Electric mobility in public transport is not about optimism, ideology, or pressure targets.
It is about kilometres, contracts, energy prices, and time.
By making these numbers public, ForeSee Advisors has allowed the debate to move from opinion to analysis — where it belongs. You can find the PDF here.
Note: This analysis is based on a publicly shared TCO model by ForeSee Advisors. All figures are assumption-driven and indicative; actual costs may vary by city, contract structure, tariffs, and operating conditions.